Understanding Probabilistic Model Distributions

What’s Likely, What’s Not — and Why It Matters?
When you're working with data, it's less about exact answers and more about what’s likely to happen. Probabilistic model distributions help you see the full picture, not just a single outcome. They show you where the data tends to fall, what’s rare, what’s common, and how confident you can be in your predictions.
What You’ll Learn
• What is a probability distribution?
• Key types of distributions (Beta, Pert, Normal, Uniform, etc.)
• How is uncertainty represented?
In this section, you’ll learn how different distributions behave, how to choose the right one for your model, and how they affect the decisions you make.
What Is a Probability Distribution?
A probability distribution is a way to map out how likely each possible result is when randomness is involved.
For example, if you roll a fair six-sided die, each number (1 to 6) has an equal chance of coming up — that’s a uniform distribution. But not all data behaves so evenly. Some outcomes are more likely than others. That’s when we turn to more complex distributions to represent reality more accurately.
In probabilistic modelling, these distributions help us answer questions like:
What’s the expected value?
How much variability is there?
How confident can we be in a prediction?
Beta: Ideal for skewed datasets with definitive minimum and maximum values, such as the time taken for drilling through a formation with known variability.
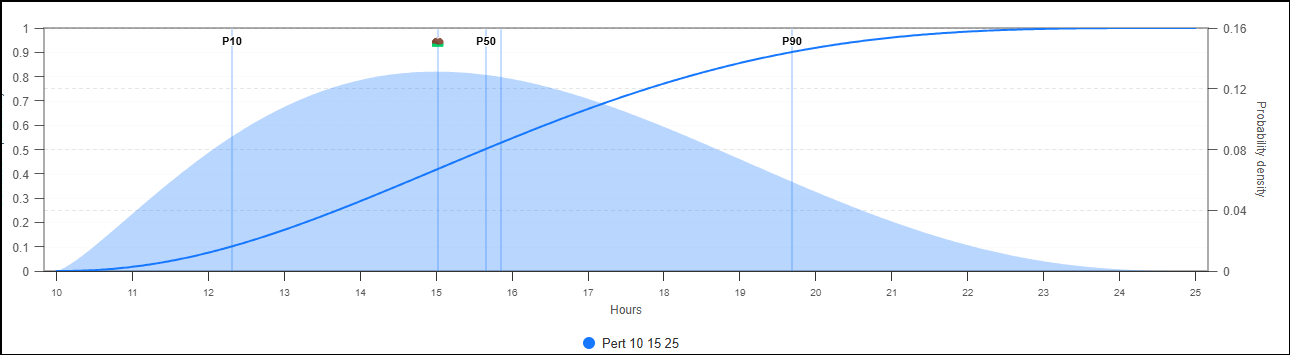
Pert: A type of Beta distribution. Ideal for estimating the duration of a task with an optimistic, likely, and pessimistic time, such as estimating the total time for a drilling operation from setup to completion.
Normal: Applies to tasks with a natural variation that tends to be symmetric around the mean, such as the time taken for standard drilling operations under consistent conditions.
Triangular: Simple model requiring a minimum, most likely, and maximum estimate, good for preliminary estimates of a new drilling operation where data is scarce.
Uniform: When each duration between a minimum and maximum is equally likely, like the time taken for a routine inspection of drilling equipment when any number of issues could be found, taking anywhere from the least to the most time possible.